
Tableau is a beautiful, relatively easy to use data visualization tool. The Tableau public product is FREE and relatively easy to use. I call it “Excel on steroids.”
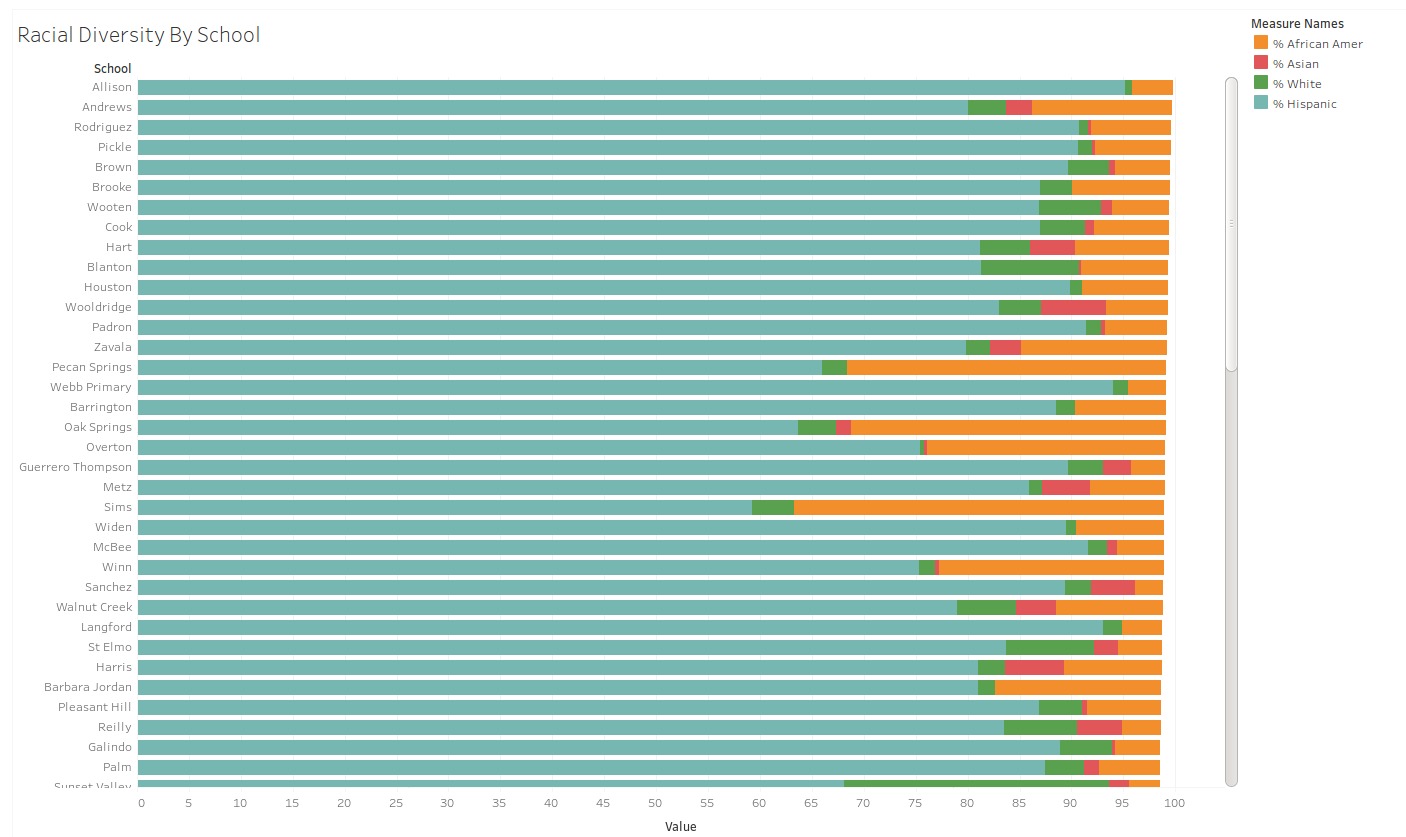
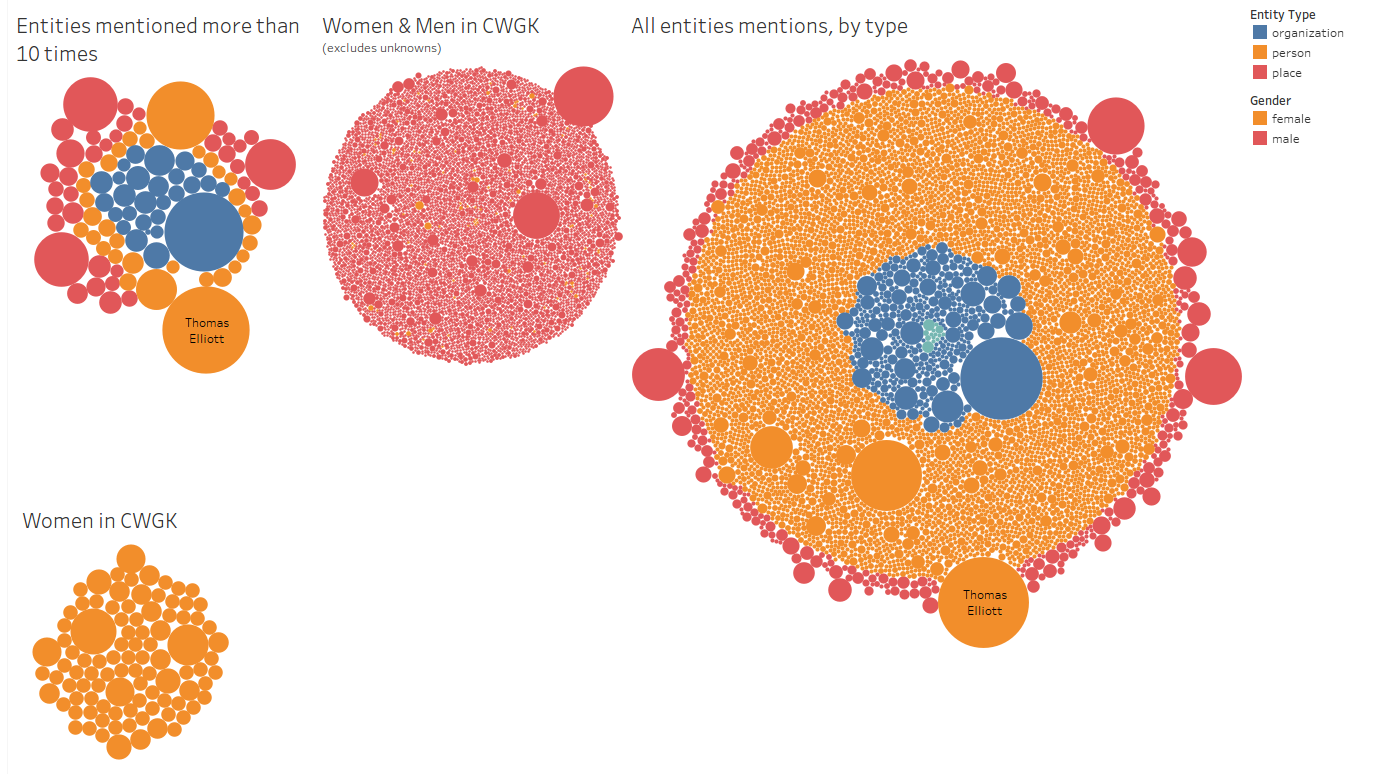
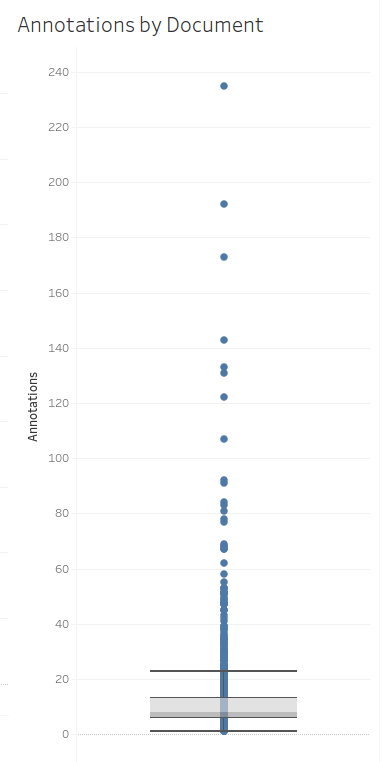
I’ve been teaching myself how to produce interactive visualizations with Tableau Public. Here’s some of what I’ve made. I’d love to take what I know and teach it to you.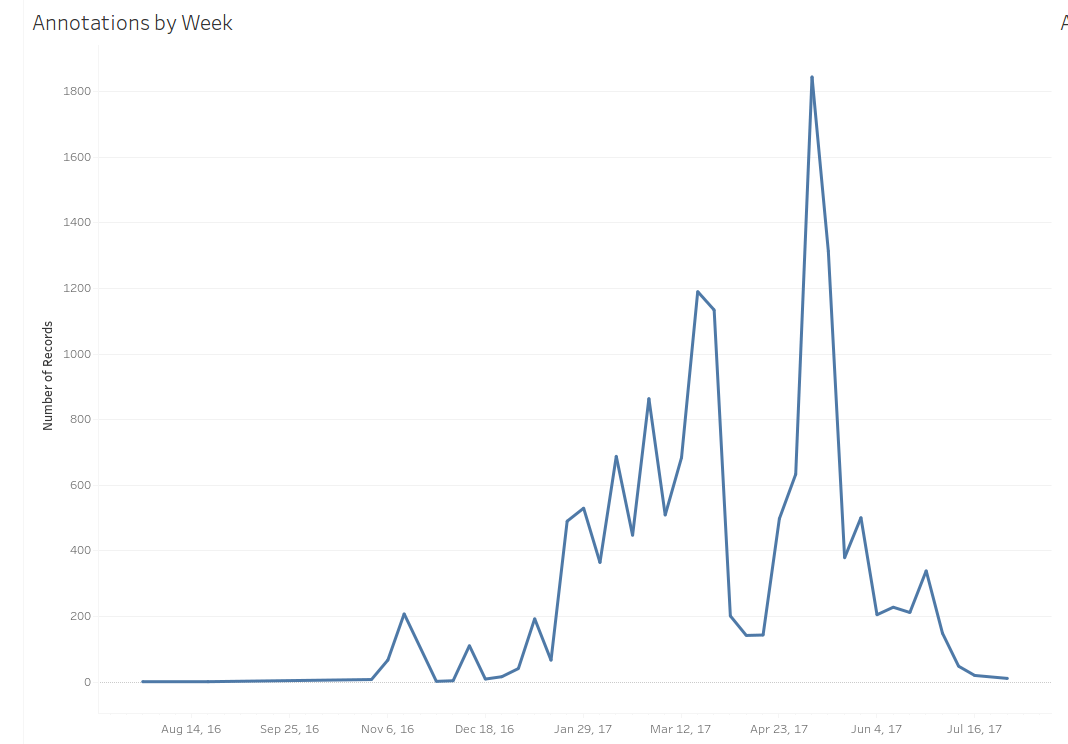
NOTE: In order to run Tableau Public you need either a Mac or Windows. I run Linux on my laptop, so I won’t have a machine capable of showing what to do. Is there someone who can work with me on this? (I noticed another attendee has a draft proposal on exactly this same topic — perhaps we could work together?)
ffffff;background: #bd081c no-repeat scroll 3px 50% / 14px 14px;cursor: pointer">Save
ffffff;background: #bd081c no-repeat scroll 3px 50% / 14px 14px;cursor: pointer">Save